Five-figure drug denials worked with the clinical evidence already built.
TYPICAL DENIAL RATE
13%
Benchmark 9%
$2.1M
in high-dollar device claims kept moving
Orthopedics
High-dollar surgical claims that clear on the first pass, not the third.
TYPICAL DENIAL RATE
14%
Benchmark 9%
1st
pass clearance, not the third
Oncology
Five-figure drug denials worked with the clinical evidence already built.
TYPICAL DENIAL RATE
15%
Benchmark 9%
5-figure
drug denials worked with evidence
Nephrology
Recurring dialysis billing with coordination of benefits kept clean.
TYPICAL DENIAL RATE
16%
Benchmark 9%
COB
kept clean on recurring dialysis
Primary care & IPAs
High claim volume absorbed, so a lean team covers far more providers.
TYPICAL DENIAL RATE
11%
Benchmark 9%
High
volume absorbed by a lean team
Multi-specialty & MSOs
One standard of revenue cycle performance across every site and specialty.
TYPICAL DENIAL RATE
13%
Benchmark 9%
1
standard across every site and specialty
Cardiology
Cardiology
Five-figure drug denials worked with the clinical evidence already built.
TYPICAL DENIAL RATE
13%
Benchmark 9%
$2.1M
in high-dollar device claims kept moving
Orthopedics
Orthopedics
High-dollar surgical claims that clear on the first pass, not the third.
TYPICAL DENIAL RATE
14%
Benchmark 9%
1st
pass clearance, not the third
Oncology
Oncology
Five-figure drug denials worked with the clinical evidence already built.
TYPICAL DENIAL RATE
15%
Benchmark 9%
5-figure
drug denials worked with evidence
Nephrology
Nephrology
Recurring dialysis billing with coordination of benefits kept clean.
TYPICAL DENIAL RATE
16%
Benchmark 9%
COB
kept clean on recurring dialysis
Primary care & IPAs
Primary care & IPAs
High claim volume absorbed, so a lean team covers far more providers.
TYPICAL DENIAL RATE
11%
Benchmark 9%
High
volume absorbed by a lean team
Multi-specialty & MSOs
Multi-specialty & MSOs
One standard of revenue cycle performance across every site and specialty.
TYPICAL DENIAL RATE
13%
Benchmark 9%
1
standard across every site and specialty
A proprietary model to benchmark against what the practice should collect
90%
of revenue is collected in the first 60 days.
01
Collection Rate
Velocity of cash in the first 60 days, measured against the fully adjudicated GCR baseline.
02
Claims Resolution Rate
Resolution of workable AR in the same 60-day window relative to total charges.
03
The 60-Day Window
The critical first billing cycle where operational decisions have the highest impact on yield.
Opportunity calculator
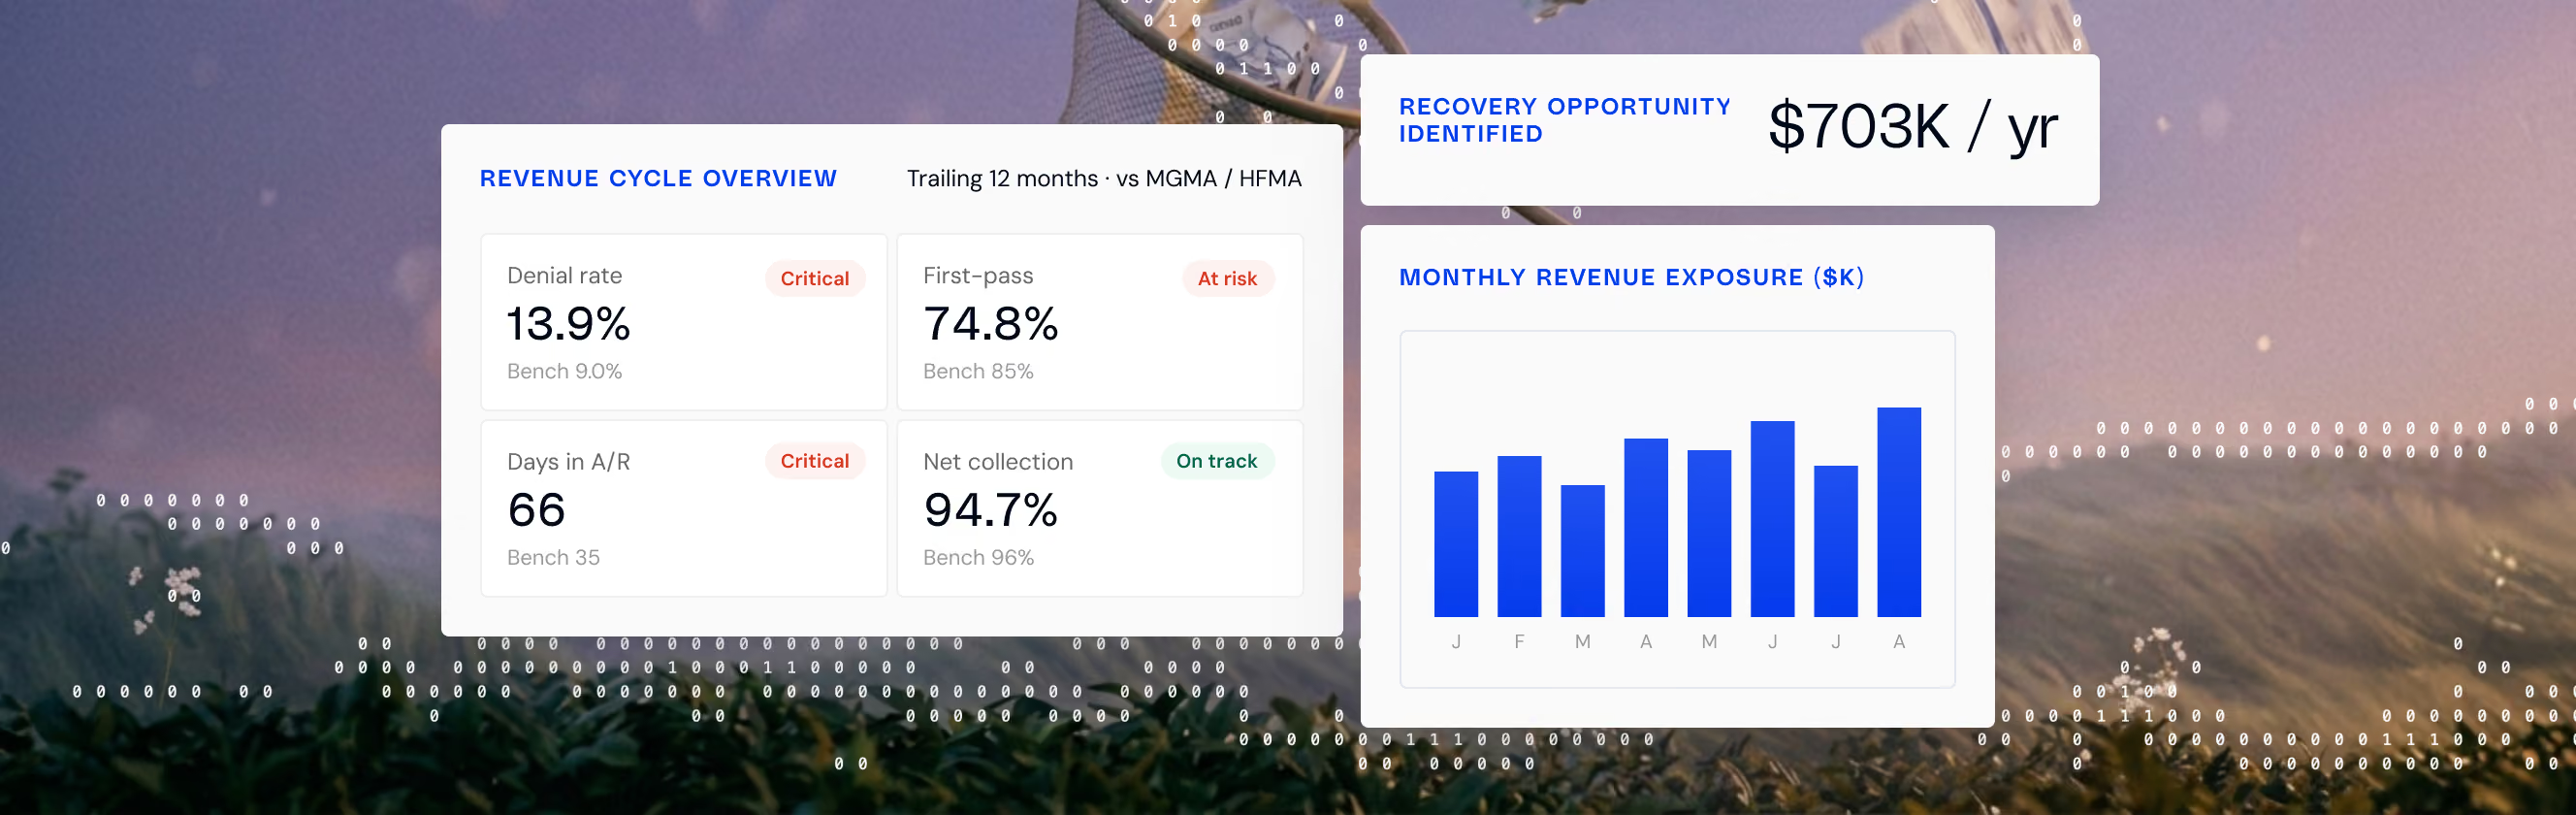
The gap between your numbers and the benchmark has a dollar value.
Set the sliders to your group. We will show the recovery hiding in your denial rate, your A/R days, and your first-pass rate, benchmarked against MGMA and HFMA. No form to fill in.
Adjust the sliders to match your group. We've pre-filled typical values for your specialty.
Estimates are illustrative and based on MGMA DataDive and HFMA MAP Keys benchmarks applied to the inputs above. They do not account for every circumstance and are not a guarantee of results. Your diagnostic uses your actual claim, remit, and denial data.
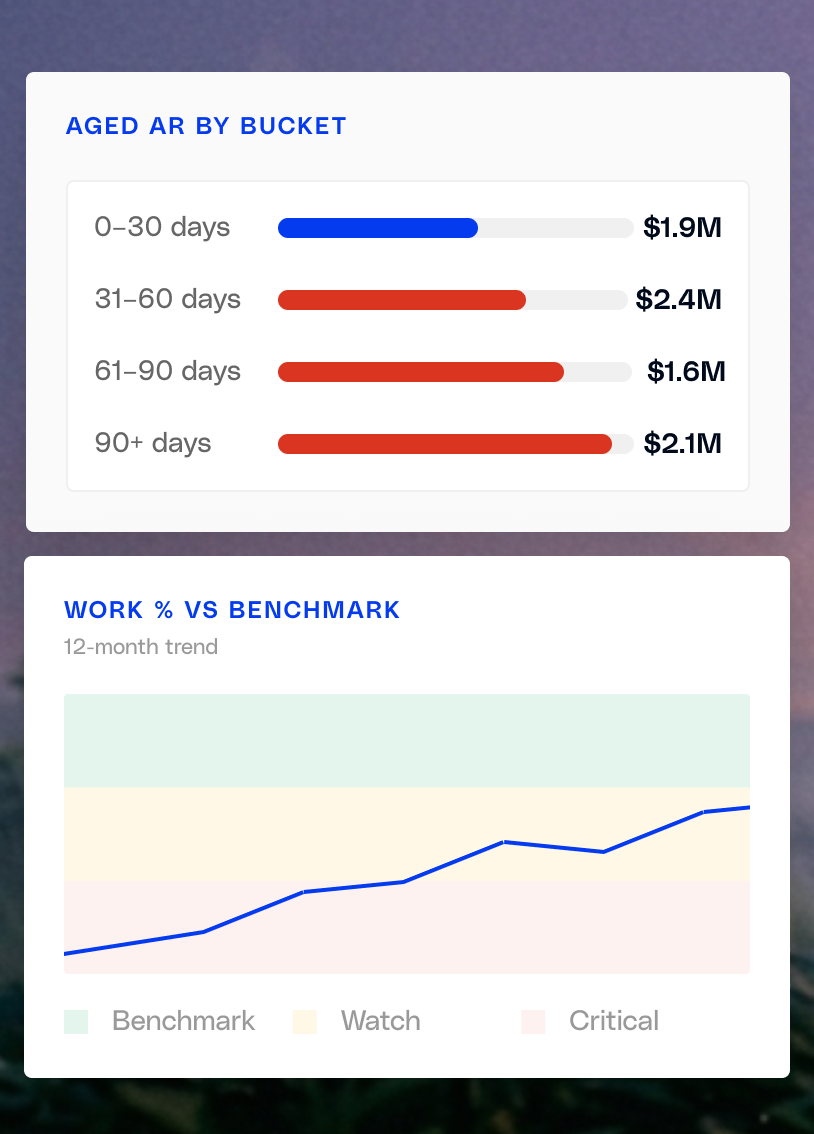
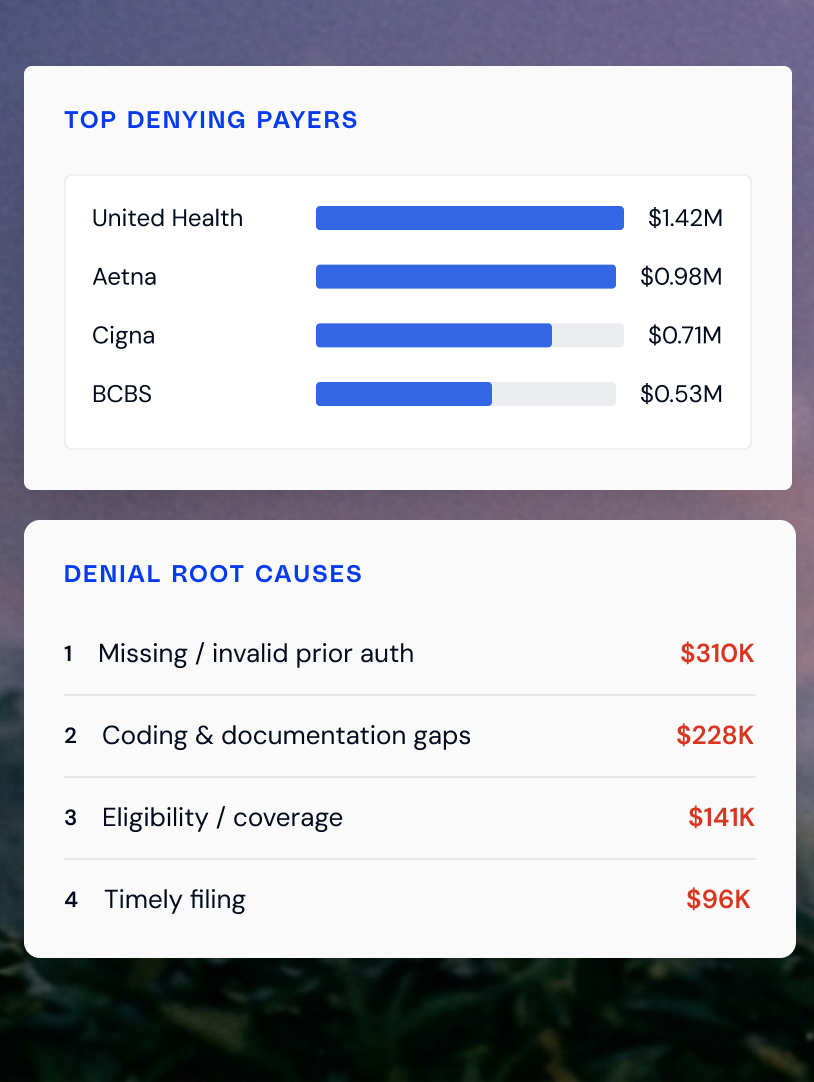
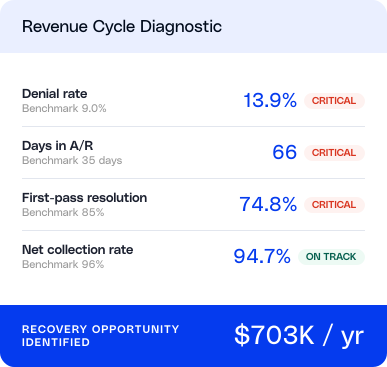
Your diagnostic readout
This is the report we build for your group, and walk you through together.
We run your claim, remit, and denial data through the same analysis, then sit down and take you through every finding, each scored against industry benchmarks and proprietary model, each tied to a specific recovery action.
We run the same diagnostic on your actual claim data, find the root causes, and hand you the recovery roadmap. Walk away with the report whether or not you work with us.
01
Intro call
Walk through your current revenue cycle priorities. No commitment.
02
Diagnostic
Read-only access to your claim and remit data. We build your benchmark report against industry standards.
03
Review & decide
We walk through the findings together. Move forward if it fits. You keep the report regardless.
Thank you! Your submission has been received!
Oops! Something went wrong while submitting the form.
Thank you! Your submission has been received!
Oops! Something went wrong while submitting the form.
.png)






.png)

%201.png)
.avif)
.avif)